Analyzing Python package downloads in BigQuery
Leigha Jarett
Developer Advocate, Looker at Google Cloud
The Google Cloud Public Datasets program recently published the Python Package Index (PyPI) dataset into the marketplace. PyPI is the standard repository for Python packages. If you’ve written code in Python before, you’ve probably downloaded packages from PyPI using pip or pipenv. This dataset provides statistics for all package downloads, along with metadata for each distribution. You can learn more about the underlying data and table schemas here. Below, I’ll walk through a few examples of how you can leverage this data.
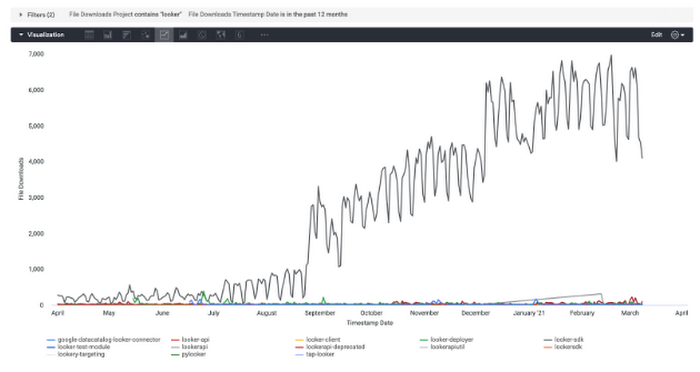
As a Python enthusiast who has helped build out various Looker packages, I was particularly interested in jumping into this dataset to learn more about how the libraries are being used. First I began by looking at the number of installations each day for the past 12 months, for packages whose name contains looker.
In the Looker platform, I can visualize this query and clearly see that looker-sdk, our official API wrapper, is the leader in terms of downloads. Additionally, I noticed a big jump at the end of August and the beginning of December, which may be the results of different marketing efforts.
One other potential application of this data is to bring in competitor packages and visualize market share over time. As a software organization, trends in downloads can help us measure the effectiveness of different developer marketing strategies and make decisions on new programs.
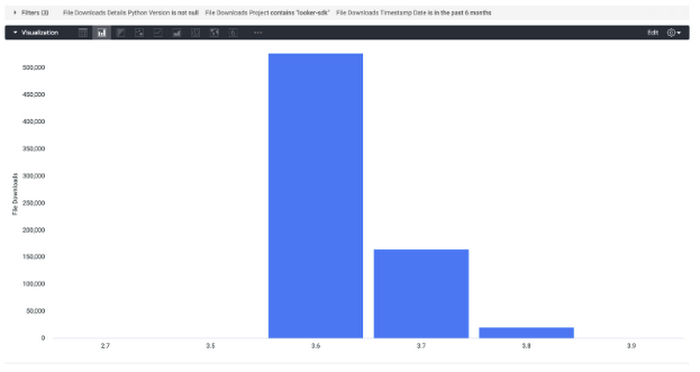
Next, I focused on just the looker-sdk package and looked at the number of installations by Python version. Knowing that most of our users are leveraging Python 3.6 means that we might want to prioritize features that are compatible with that version. This knowledge can also be helpful in messaging users regarding updating their environments for the best experience.
I can easily save the results of the query to Google Sheets and share with our marketing team. Alternatively, in a tool like Looker, I can schedule the report to be emailed on a monthly basis so our team stays up-to-date on user trends. As a next step, I might join this data onto the Github dataset also available in the marketplace to see if there is a relationship between git activity and package installations.