Visualizing spatial data is an important task. In this mini-tutorial, you will learn how to quickly visualize OpenStreetMap (OSM) data with PostGIS and QGIS. The idea is to get you started as fast as possible, and to make the most out of your data.
Table of Contents
QGIS is freely available as Open Source software and can be used free of charge. It is a powerful tool to edit and visualize spatial data which is ideally stored in a PostGIS-enabled PostgreSQL database.
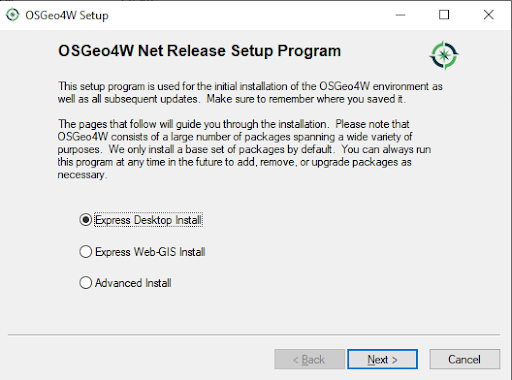
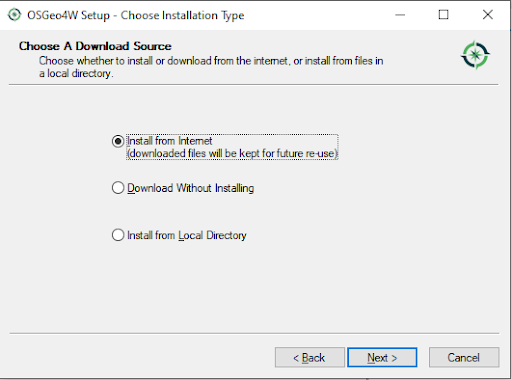
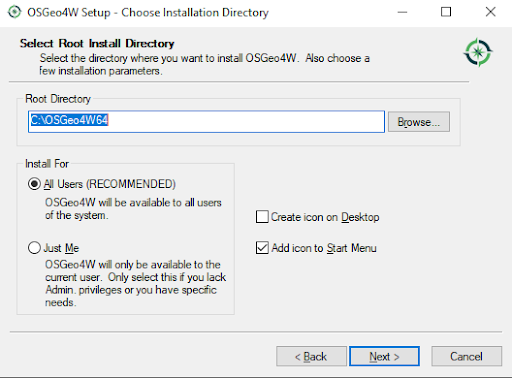
First, download QGIS from the official website.
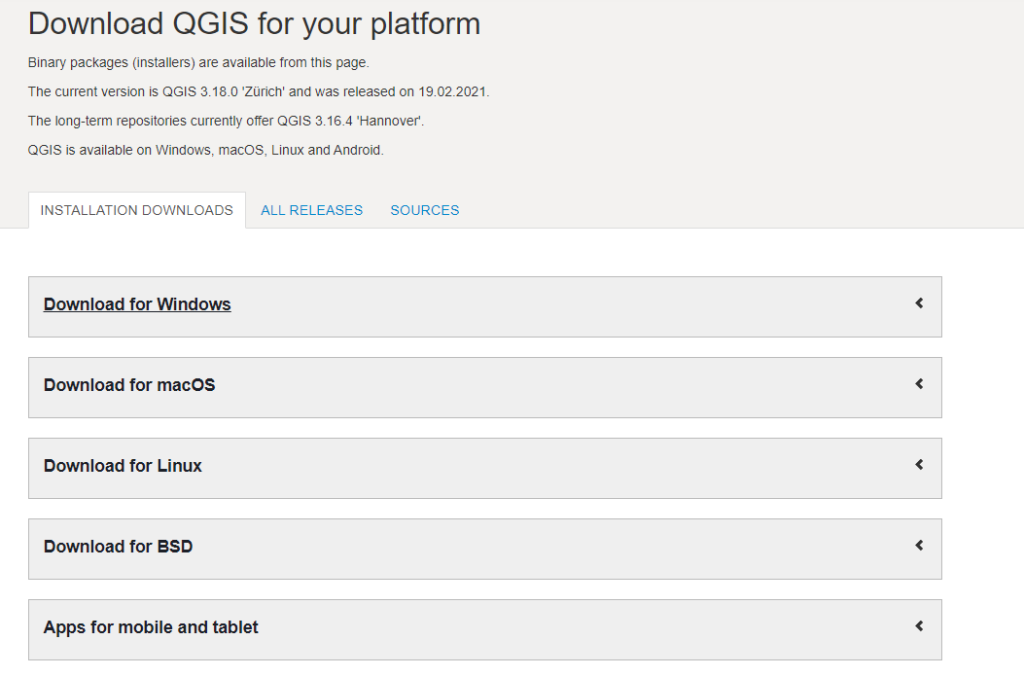
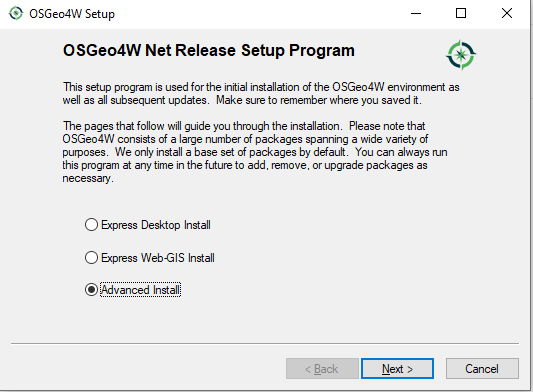
Once the package has been downloaded, you can simply follow the installation instructions. The following gallery shows how this works. Installing QGIS should be relatively easy.
The next thing we have to do is to install PostgreSQL and to load OpenStreetMap (OSM) data. There are various ways to load OSM data. Many people use osm2pgsql, which has become pretty popular over the years. If you want to learn more about loading OSM data into a PostgreSQL database, please check out Florian Nadler’s excellent OSM / PostgreSQL tutorial dealing with this issue.
Since we want to primarily focus on QGIS-related questions here, I have used Scalefield to create a small PostgreSQL instance and to load OSM data directly. Scalefield comes with a built-in mechanism to populate data sets directly during the provisioning process of your PostgreSQL service, as shown in the next gallery.
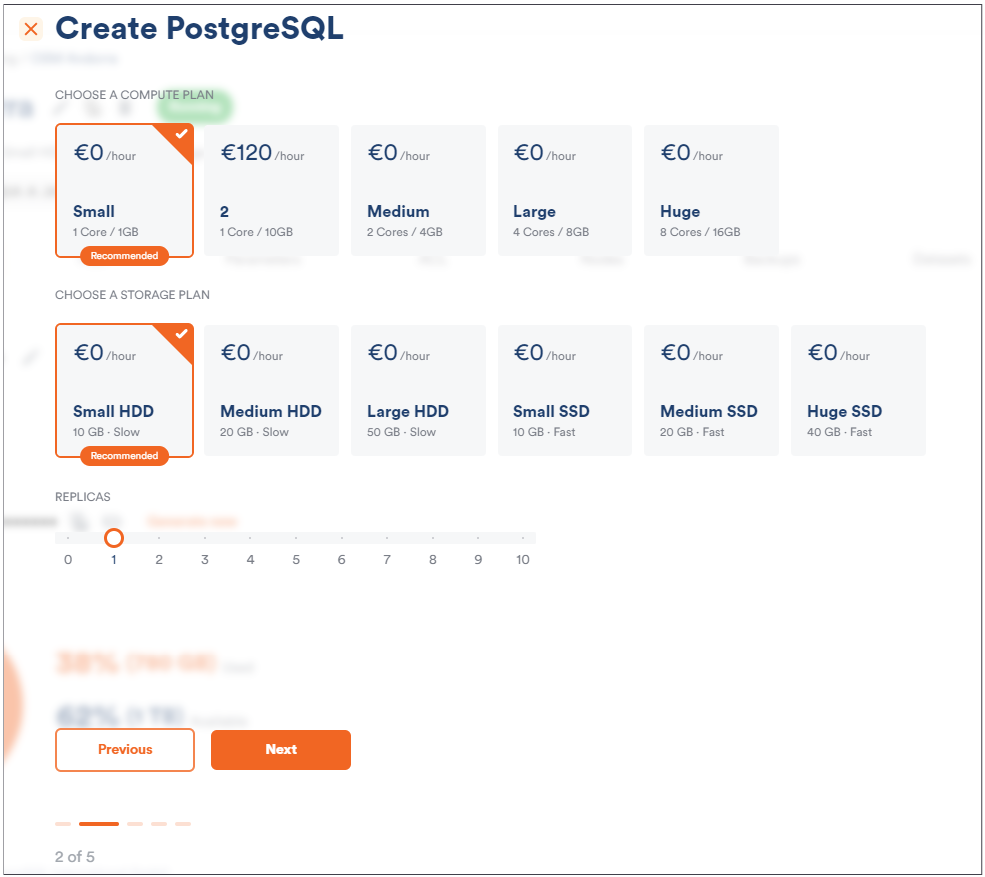
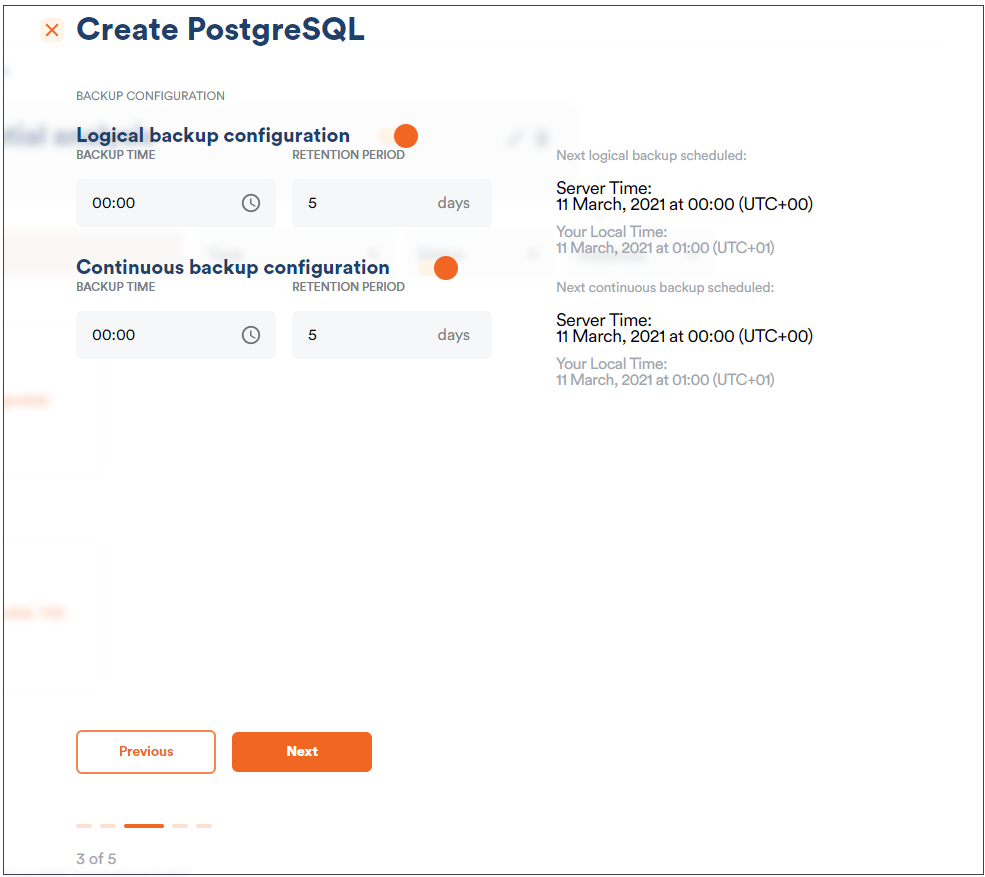
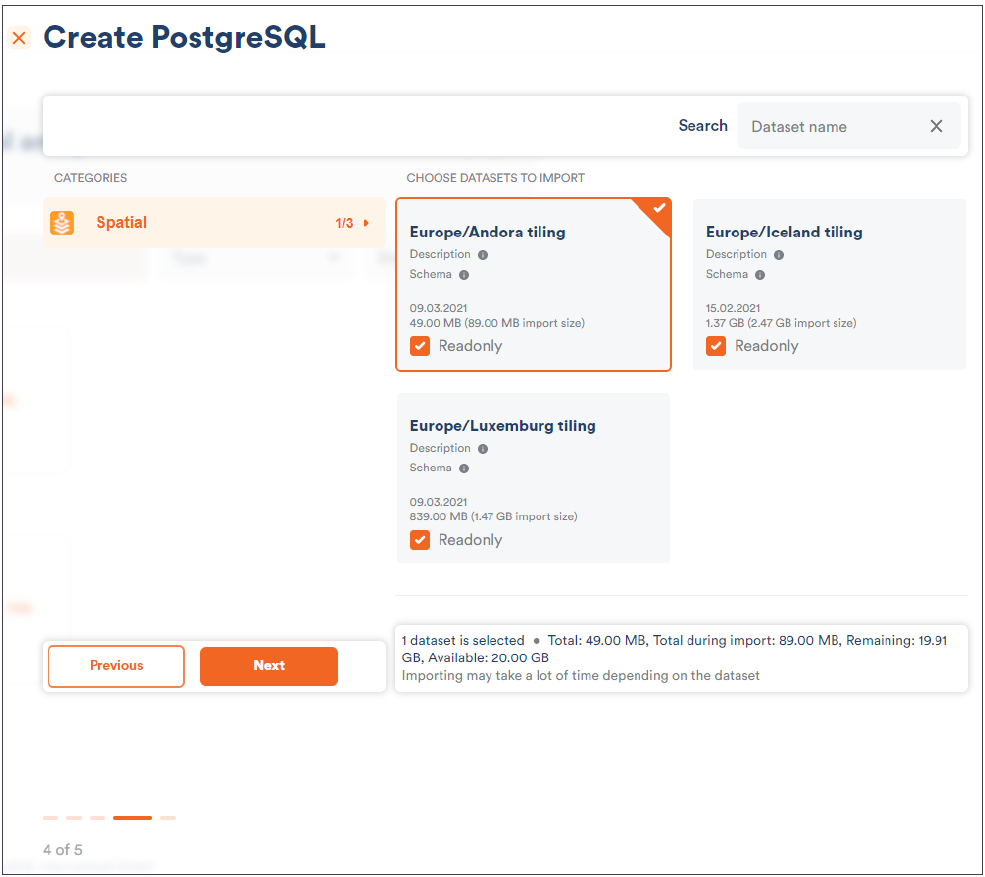
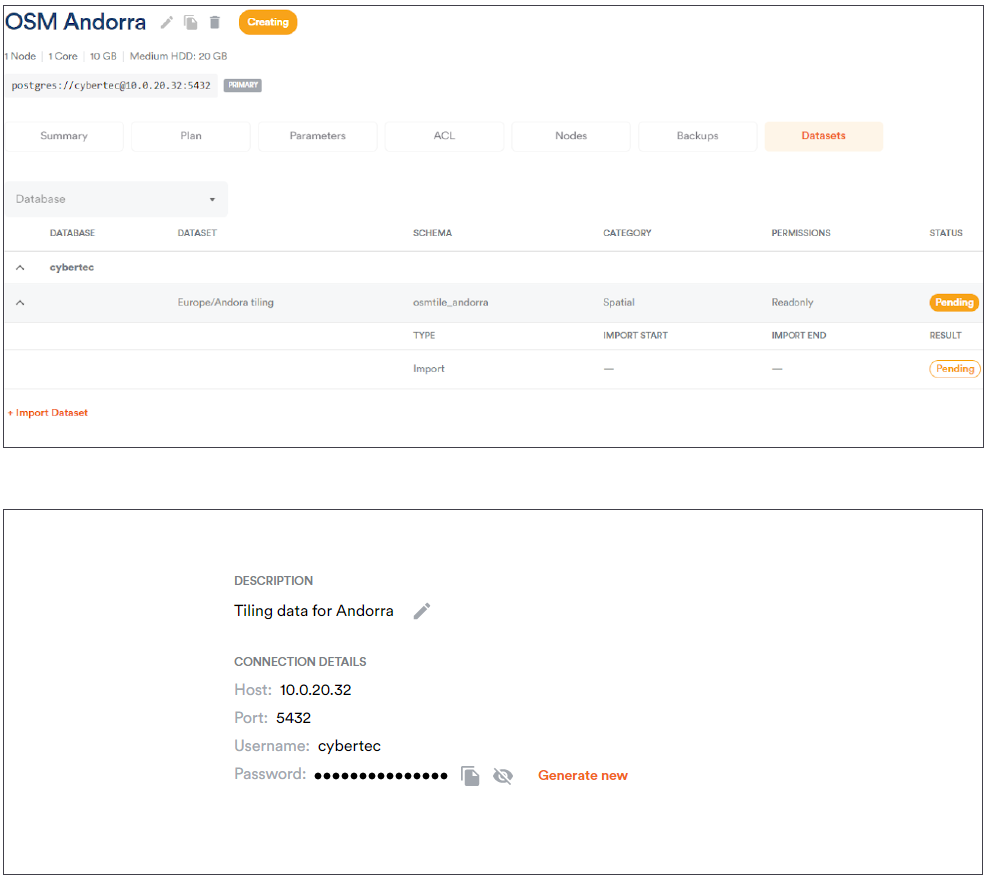
Make sure that you have deployed your desired OpenStreetMap data. In my example, I simply loaded OSM data for Andorra because it is the quickest way to get started. However, any other data set will serve the same purpose.
If you want to use QGIS to visualize your spatial data, the first thing is to define the database connection you want to use. Click on “Create a New PostGIS connection” and fill out the connection data in the form which pops up.
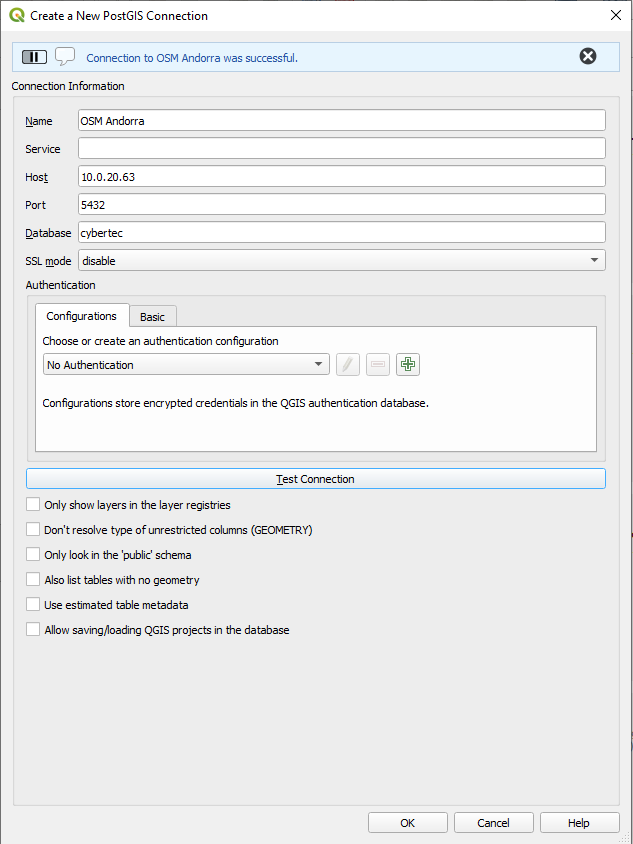
The beauty here is that QGIS allows you to immediately verify the database connection to ensure that the connection works smoothly later on.
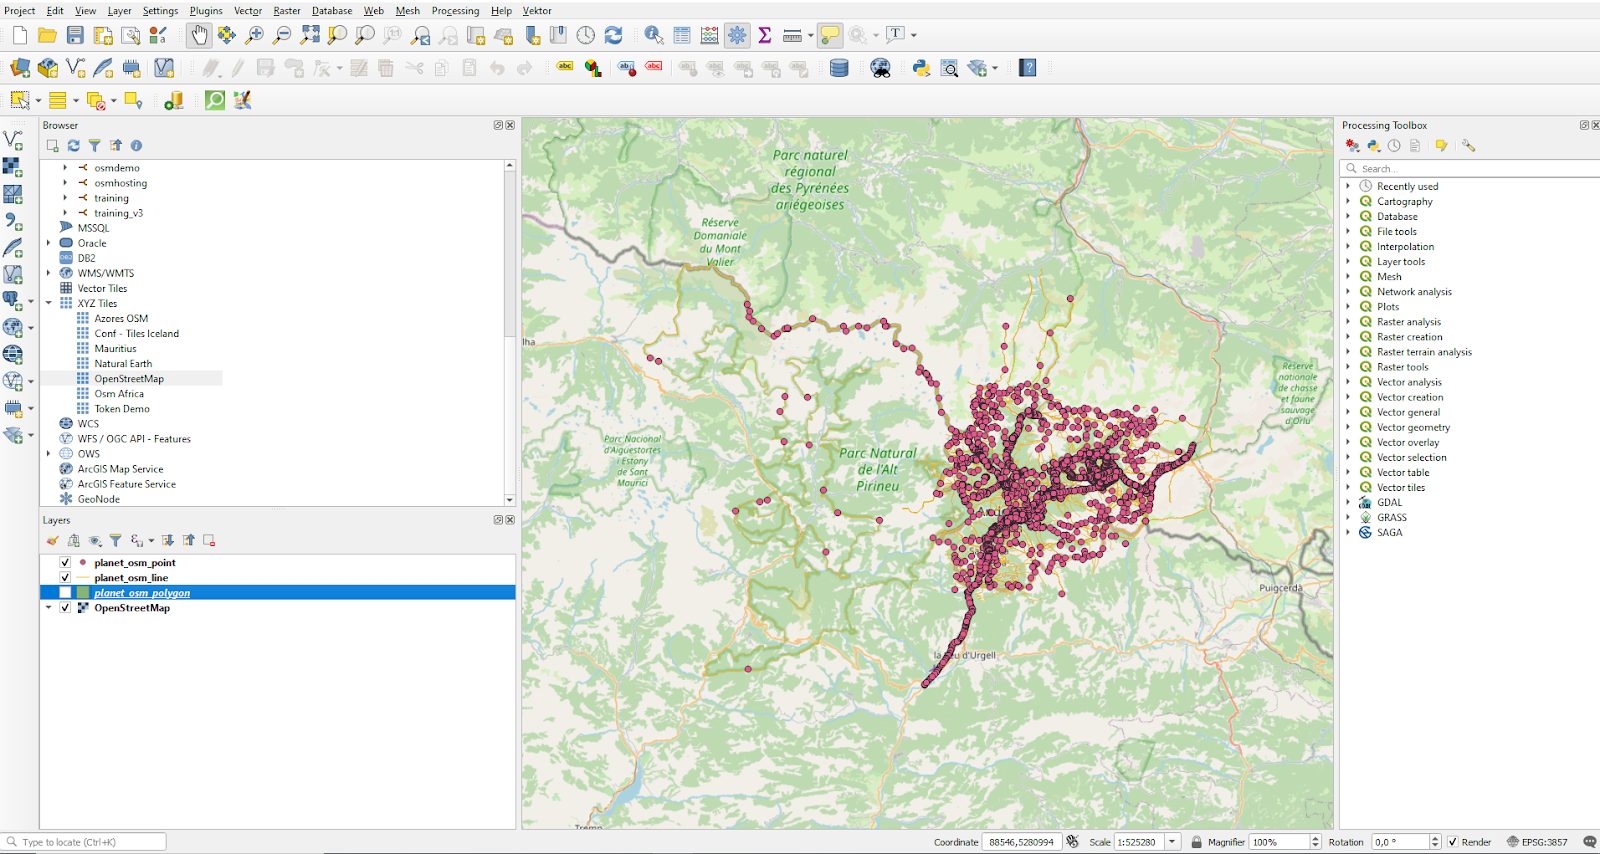
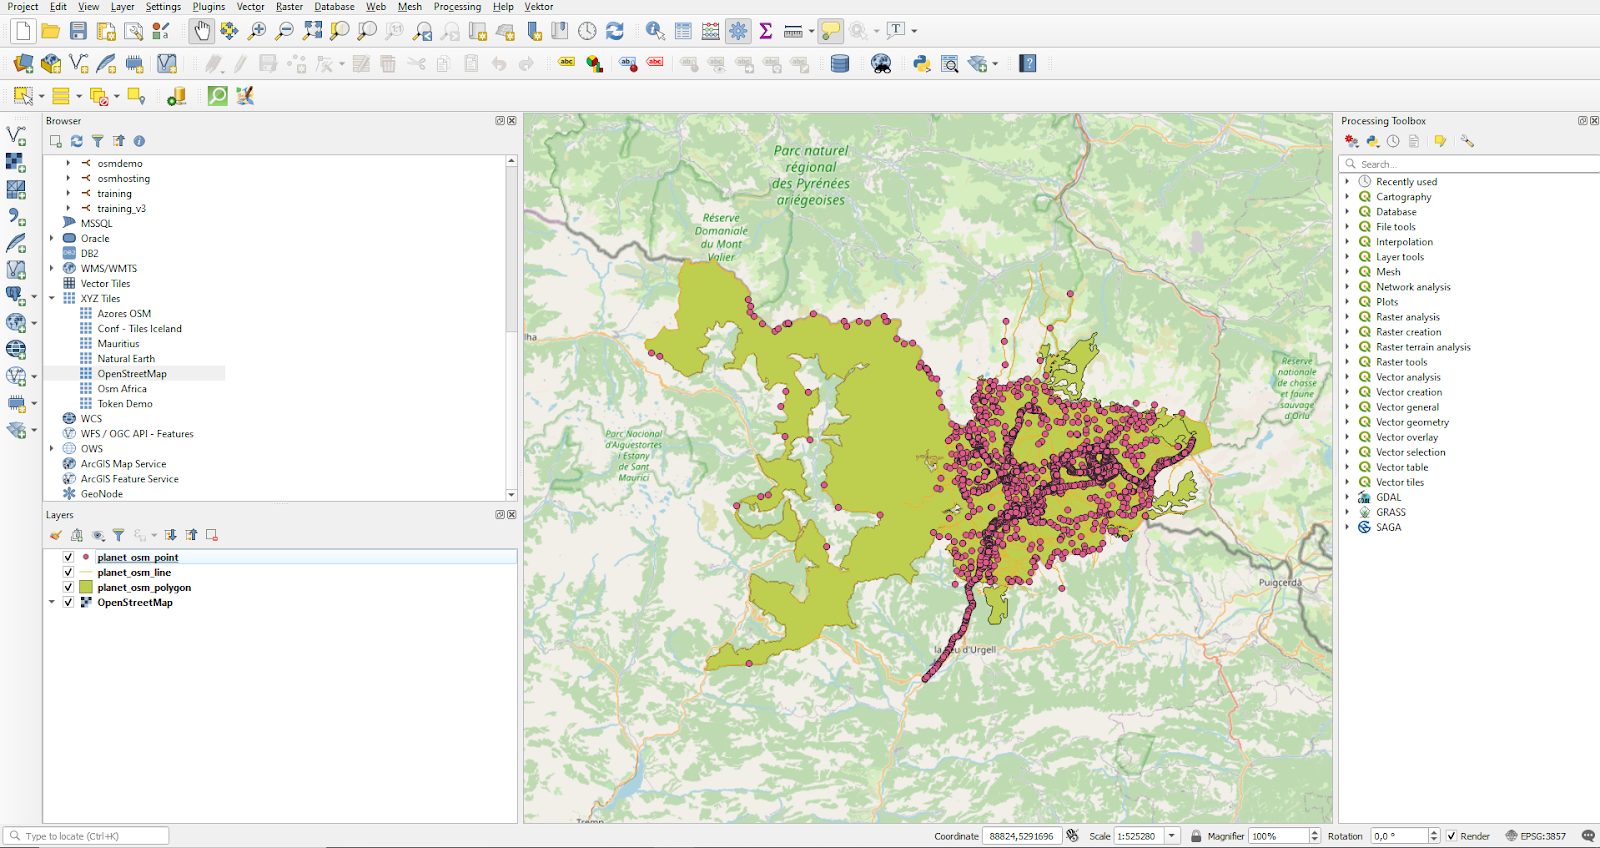
The core concept we are looking at here is the idea of a “layer”. A map is not usually made out of a simple column, but consists of various types of information all put into a single image. In our case we want to use columns from all four OSM tables. We can select the Andorra data set on the left side and mark those columns. QGIS will visualize the selected data for us immediately.
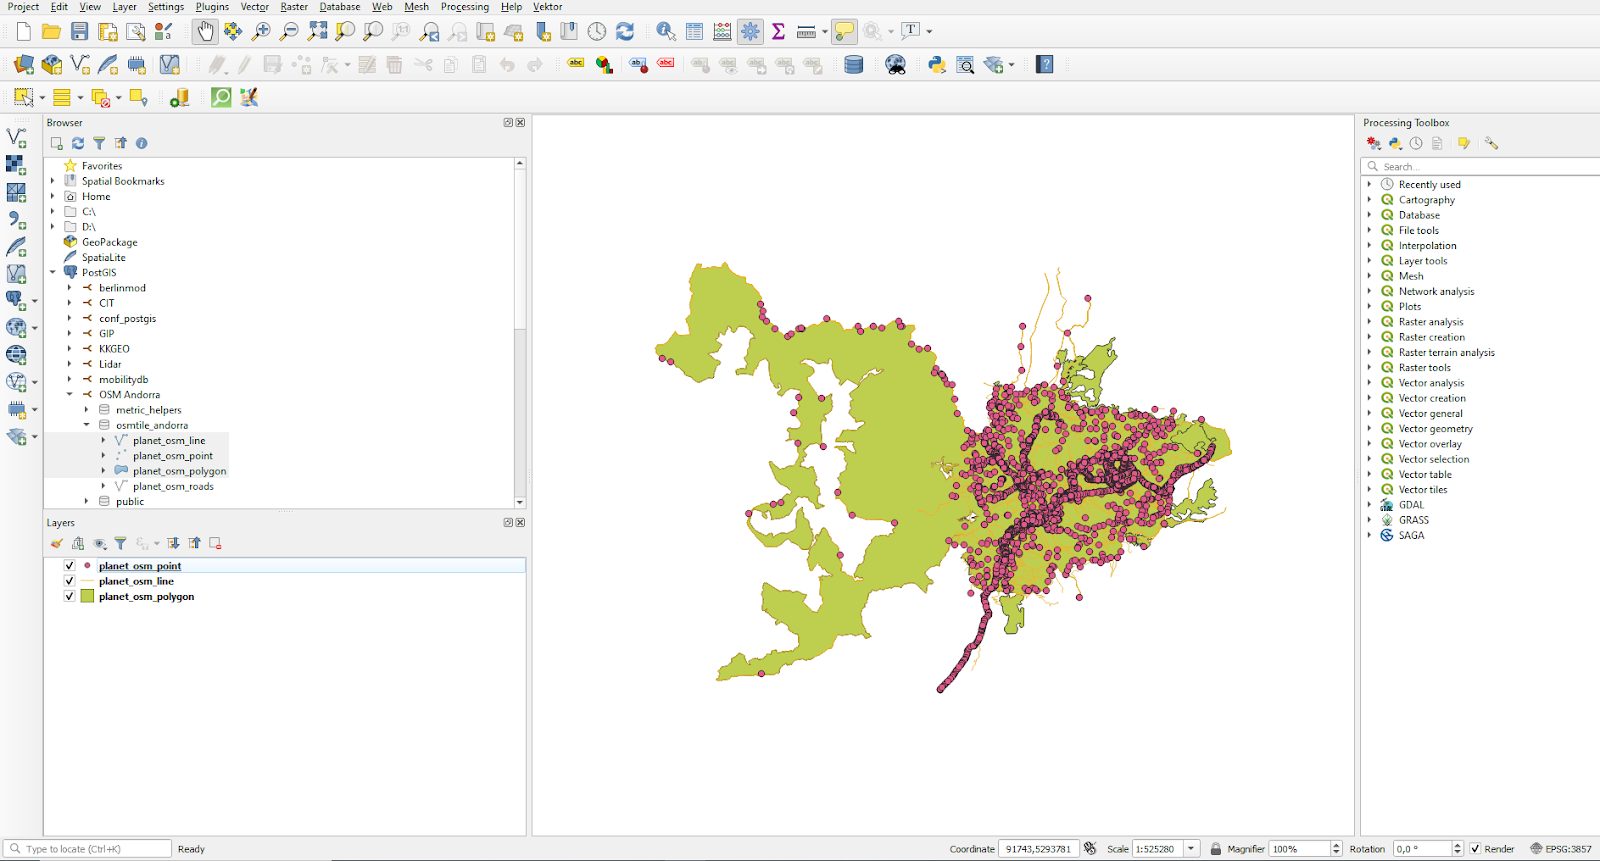
Voilà, you have visualized your first OSM data set. As you can see, the process only takes a couple of minutes. However, QGIS offers a lot more. You can create all kinds of fancy maps, and even edit your data. Speedy and practical!
For a tutorial on using PostGIS to calculate optimized trip costs, see Florian Nadler’s post on the Traveling Salesman Problem.
+43 (0) 2622 93022-0
office@cybertec.at