
 The rise of sensors and connected devices will lead to applications that draw from network/graph data management and analytics. As the number of devices surpasses the number of people — Cisco estimates 50 billion connected devices by 2020 — one can imagine applications that depend on data stored in graphs with many more nodes and edges than the ones currently maintained by social media companies.
This means that researchers and companies will need to produce real-time tools and techniques that scale to much larger graphs (measured in terms of nodes & edges). I previously listed tools for tapping into graph data, and I continue to track improvements in accessibility, scalability, and performance. For example, at the just-concluded Spark Summit, it was apparent that GraphX remains a high-priority project within the Spark1 ecosystem.
Another reason to be optimistic is that tools for graph data are getting tested in many different settings. It’s true that social media applications remain natural users of graph databases and analytics. But there are a growing number of applications outside the “social” realm. In his recent Strata Santa Clara talk and book, Neo Technology’s founder and CEO Emil Eifrem listed other uses cases for graph databases and analytics:
- Network impact analysis (including root cause analysis in data centers)
- Route finding (going from point A to point B)
- Recommendations
- Logistics
- Authorization and access control
- Fraud detection
- Investment management and finance (including securities and debt)
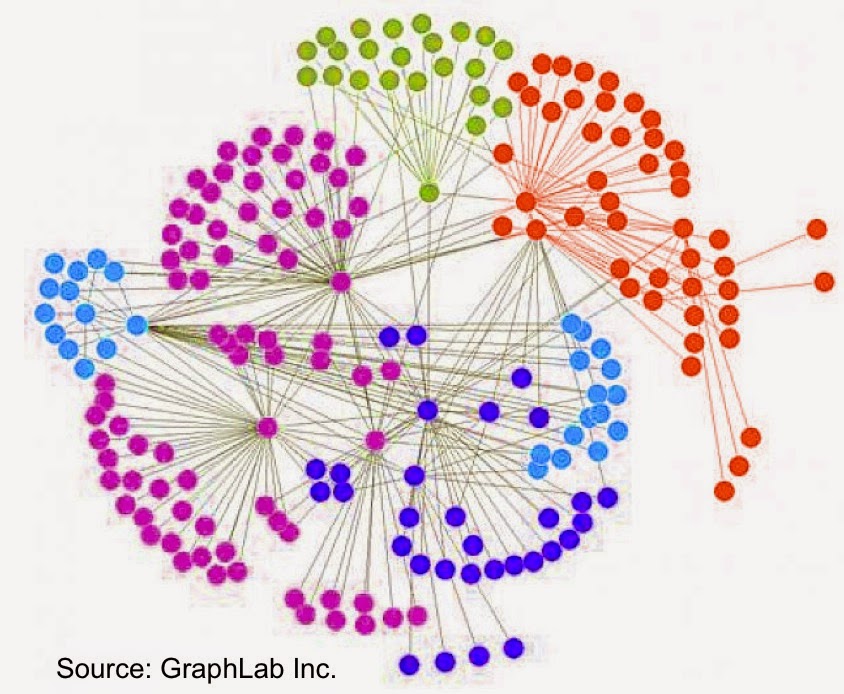
The widening number of applications means that business users are becoming more comfortable with graph analytics. In some domains network science dashboards are beginning to appear. More recently, analytic tools like GraphLab Create make it easier to unlock and build applications with graph2 data. Various applications that build upon graph search/traversal are becoming common, and users are beginning to be comfortable with notions like “centrality” and “community structure”.
A quick way to immerse yourself in the graph analysis space is to attend the third GraphLab conference in San Francisco — a showcase of the best tools3 for graph data management, visualization, and analytics, as well as interesting use cases. For instance, MusicGraph will be on hand to give an overview of their massive graph database from the music industry, Ravel Law will demonstrate how they leverage graph tools and analytics to improve search for the legal profession, and Lumiata is assembling a database to help improve medical science using evidence-based tools powered by graph analytics.
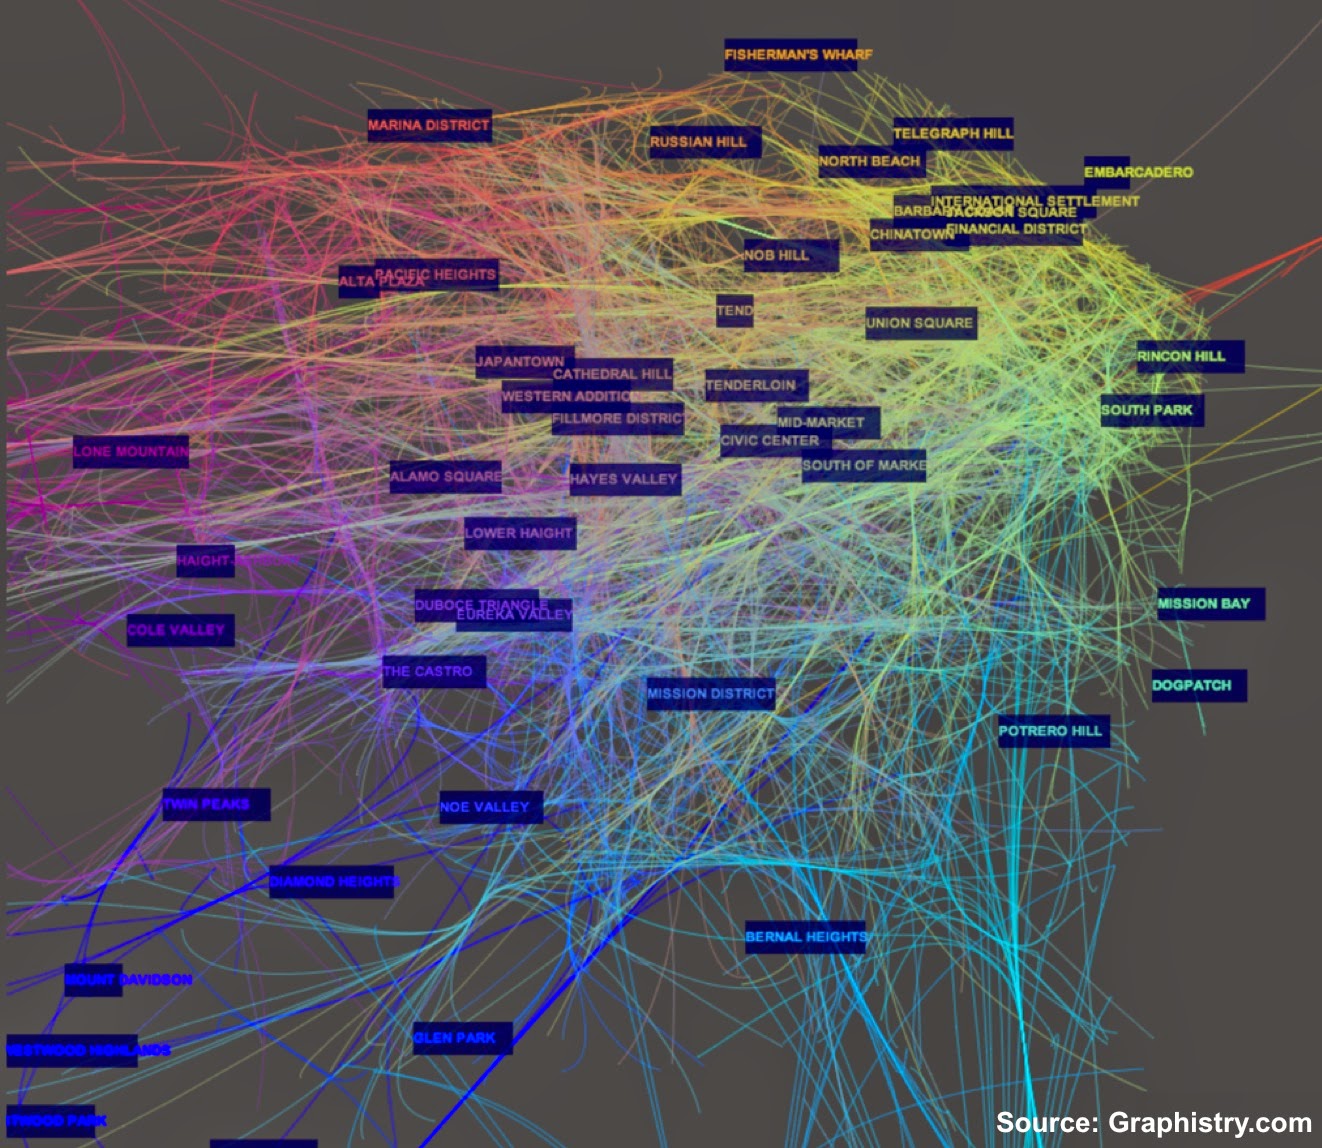 Interactive analyzer of Uber trips across San Francisco’s micro-communities
(Note: If you’re interested in attending the GraphLab conference, use the following 20% discount code.)
1. Full disclosure: I am an advisor to Databricks — a startup commercializing Apache Spark.↩
2. As I noted in a previous post, GraphLab has been extended to handle general machine learning problems (not just graphs).↩
3. Exhibitors at the GraphLab conference will include creators of several major graph databases, visualization tools, and Python tools for data scientists.↩
Related Content: