AWS Database Blog
Debugging Your AWS DMS Migrations: What to Do When Things Go Wrong (Part 1)
With the advent of managed enterprise-scale cloud database solutions like Amazon Aurora (with MySQL and PostgreSQL compatibility) and managed NoSQL solutions like DynamoDB, moving data between data stores has become very important. AWS Database Migration Service (AWS DMS) does a great job of helping you move your data between multiple supported data store targets.
However, as you know, migrations can be tricky, especially when you’re moving from one database engine to another (heterogeneous migrations). From our experience, migrations are complex, where multiple factors like resources (on source, target, and replication instance), network, nature of data, etc. play a big part in determining success.
This post walks you through a troubleshooting flow chart to help you understand what could go wrong with migrations using AWS DMS, and it discusses best practices for debugging your AWS DMS migrations. It assumes that you have a running migration task (refer to our step-by-step walkthroughs to get started on one). This process involves creating the required AWS DMS components—like the replication instance, source and target endpoints, and the replication task to migrate data from the source endpoint to the target endpoint.
This is the first post in a three-part series that covers the following components:
- Environment troubleshooting and basic task log troubleshooting (covered in this post)
- Task settings dissection—understanding in-depth the various task settings
- Understanding AWS DMS CloudWatch metrics
Migration troubleshooting overview
Here is a flow chart to help you troubleshoot AWS DMS migrations:
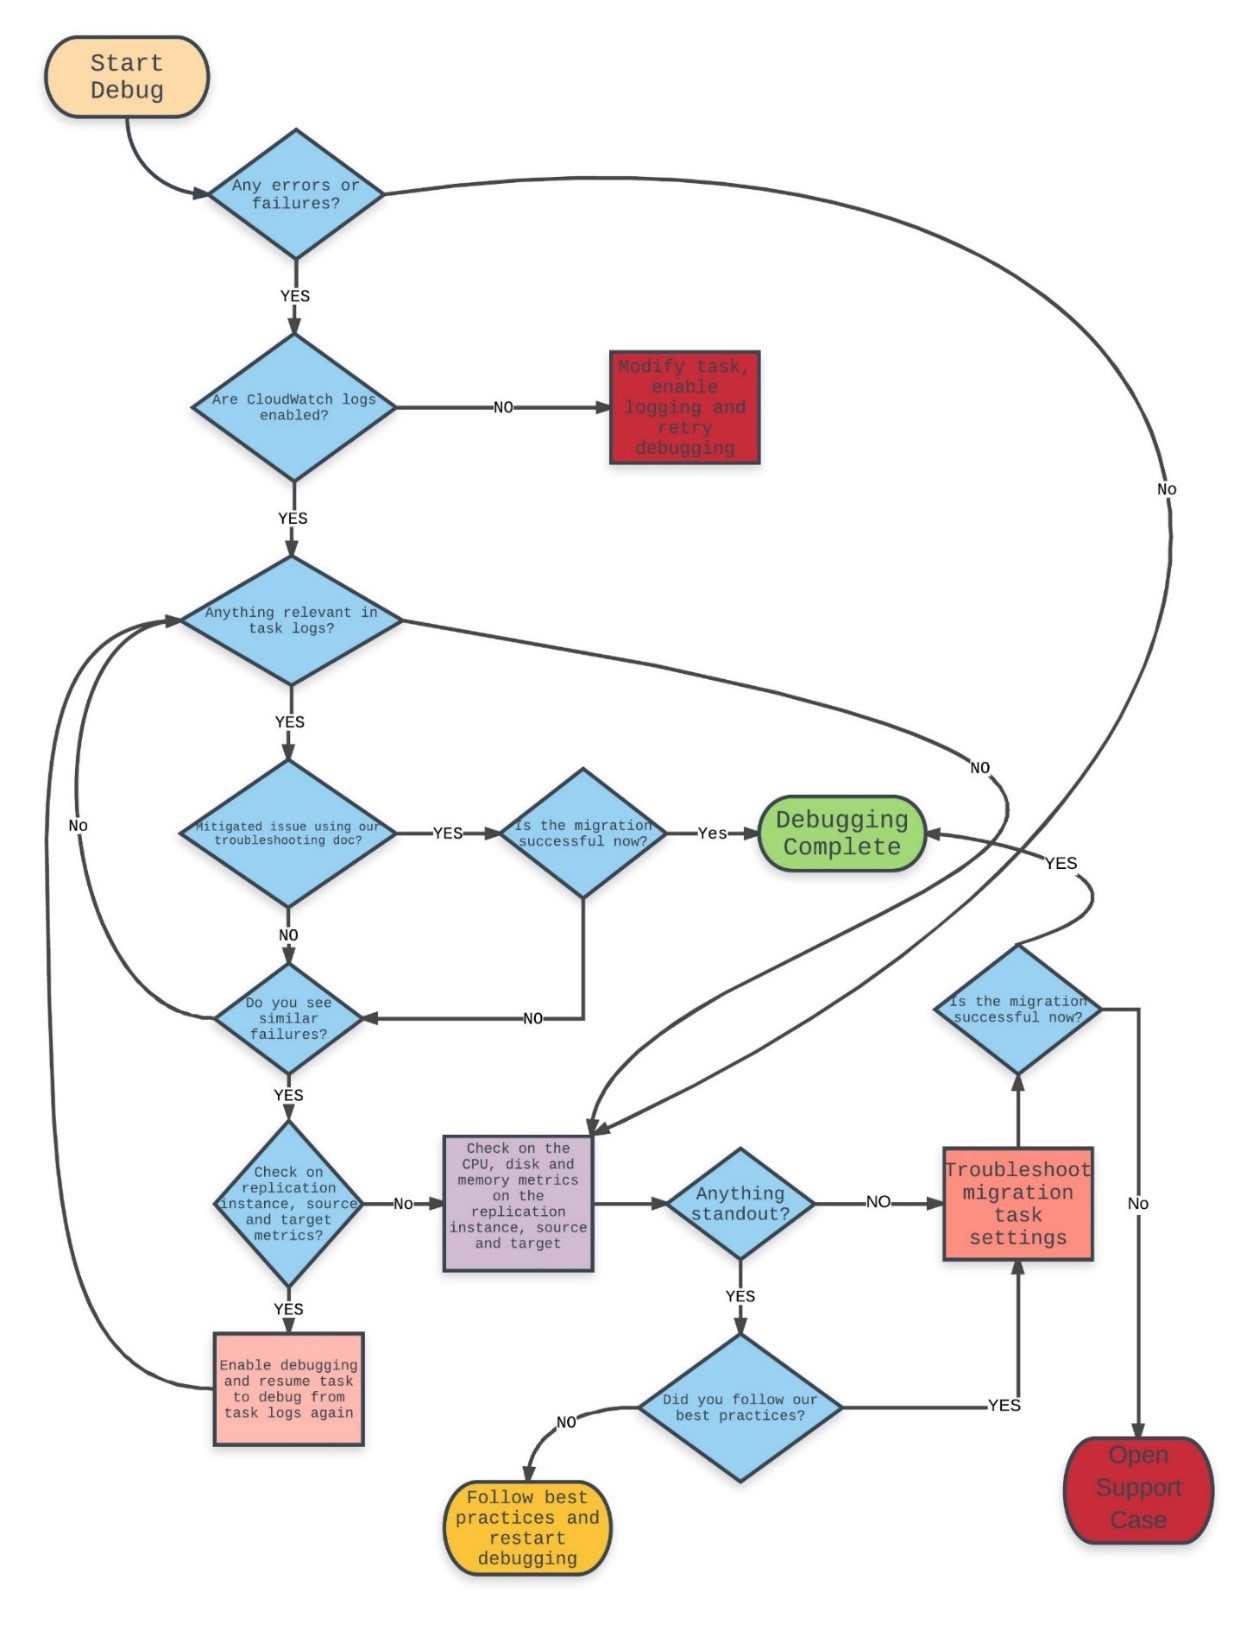
Like any other AWS service, AWS DMS relies on logging and appropriately provisioned CPU, disk, and memory resources. As we traverse the flow chart through all the decision boxes, we explore what the importance of each step is in this troubleshooting process. We talk about a few tips and tricks that we have picked up along the way while helping debug thousands of AWS DMS migrations. As stated earlier, migrations are complex and require some configuration tuning and testing based on a number of factors to be successful. As you determine the best possible configuration parameters for your migration using AWS DMS, here are a few factors to consider:
- Infrastructural issues on the AWS DMS replication instance or source database or target database instances
- Network issues between the source and replication instance or between the replication instance and the target
- Data-related issues on the sources
- AWS DMS limitations (you can find specific limitations for each of our sources and targets)
Using Amazon CloudWatch Logs
First, the most important thing to note is that AWS DMS exposes task logs to customers via CloudWatch Logs. Note that AWS DMS also exposes task logs and resource metrics via Amazon CloudWatch. Although we touch on CloudWatch metrics in this post, we will talk in more detail about specific task-based CloudWatch metrics in another post as part of this debugging series.
CloudWatch Logs contain invaluable information that can help you determine the root cause of a migration failure almost immediately in many cases. CloudWatch logging is not enabled by default when you create a migration task in AWS DMS. You need to explicitly enable it to know more about what exactly is going on with your migrations, especially when you experience failures or you’re trying to debug an AWS DMS migration. So one of the initial steps when you start debugging an AWS DMS migration is to make sure that you have CloudWatch logging enabled for the task.
Although the underlying host for AWS DMS is an Amazon EC2 Linux machine, customers don’t have access to it. This is because AWS DMS is a managed service in which AWS takes care of maintenance and ensures the proper functioning of the replication instance. In all, here are the steps you need to take when CloudWatch logging is not enabled for your task and debugging is required:
- Stop the migration task.
- Modify the migration task.
- Select the Enable logging check box.

Log forensics best practices
Task logs are often great sources of information to know more about what exactly is going on with the current migration. Every AWS DMS task generates its own log stream in Amazon CloudWatch with a randomly generated identifier that identifies the task. To help you navigate through this section, follow our migration troubleshooting guide. It contains good examples of probable migration issues that you might encounter with AWS DMS.
The following are some best practices that have helped us debug many migrations before.
Search directly for appropriate errors or warnings while debugging failed migrations
- You can search for “E:” to find log lines that tell you more about what errors might have caused the issue in the first place.
- You can search for “W:” to find log lines that could tell you more about possible warnings during the migration.
Here is an example of how helpful error messages can be while debugging AWS DMS migrations:

Here, AWS DMS could not continue with the TARGET_APPLY step because the relation/table that AWS DMS was writing to does not exist anymore on the target instance. Many times, error messages can give you the exact root cause of the issue to help you understand better.
Know which phase the migration is failing at
There are a couple of things you can look for when searching through the AWS DMS task logs:
- Finding different logger levels for each migration phase
- Understanding what migration phase you’re having issues in
Here is a list of all logger levels in any migration phase:
- LOGGER_SEVERITY_DEFAULT: Default logging
- LOGGER_SEVERITY_ERROR: Log only errors for appropriate phase
- LOGGER_SEVERITY_WARNING: Log only warnings
- LOGGER_SEVERITY_INFO: Log only info lines
- LOGGER_SEVERITY_DEBUG: Log in debug mode (more verbose than default)
- LOGGER_SEVERITY_DETAILED_DEBUG: Most verbose logging
Note: Choosing 5 and 6 could fill up the underlying disk on the replication instance because they generate a lot of logs.
Here is a list of relevant migration phases:
- SOURCE_UNLOAD: Unloading data from the source during the full load phase
- TARGET_LOAD: Loading data into the target during full load phase
- SOURCE_CAPTURE: Setting up initial capture during full load to make sure that all prerequisites are taken care of and data changes are captured during the change data capture (CDC) phase
- TARGET_APPLY: Applies captured changes to the target during the CDC phase
It’s also important to know which exact component (as explained earlier) failed so that you can do more research on the possible root causes during an AWS DMS migration failure. From the example in the previous section, you can determine from the error that the task was in the CDC phase, trying to keep the target in sync with the source while AWS DMS encountered a table that it could not write to. Based on the phase of the migration, you can confirm that the problem was indeed on the target side of things. There are many other stages within the replication engine itself, but knowing these stages during the debugging process is a good place to start.
Here are some other things to check:
- Pay attention to the times of the errors reported. By default, all times reported are in UTC. If required, convert the times according to the time zone of your source or target database, and then continue with the investigation. Sometimes, it makes sense to look at the latest error and continue the investigation from there. Make sure that you scroll through the entire CloudWatch log if you’re looking for the latest errors. If you prefer, you could also create an Amazon S3 bucket and upload logs to Amazon S3 using the instructions in Exporting Log Data to Amazon S3.
- If the basic errors are not helping, you could turn on detail debug logging for the appropriate task steps where you are hitting these errors. You can do this via the AWS CLI using the modify-replication-task command in the following manner:
The settings.json file contains the entire task settings JSON except for the following logger component, which is changed to detail debug (for the source_unload step) in the following manner:
Debug logging generates log messages at a larger magnitude than default logging. Running a task continuously in debug mode could fill up the underlying storage, affecting migration tasks running on that instance. For your convenience, you can set the Severity to any of the logger levels mentioned earlier.
Example: Sometimes, AWS DMS relies on error messages from the drivers that are used to connect to the source database instance to showcase messages. Depending on what the driver exposes at debug (verbose) level, AWS DMS also uses the same logging level in the task logs. Here is an example error message that we found in debug logs for a failed task:
As you can see, AWS DMS was trying to establish a connection to a PostgreSQL instance and could not do so because the remaining connection slots were reserved. Because the driver exposes this error only in debug mode, we saw this only after enabling debug logging (all debug log lines start with “D:” and “T:” for DETAILED_DEBUG).
Replication instance forensics best practices
After going through the log forensics exercise, if you still have issues with errors or warnings that you can’t mitigate, the next step is to make sure that the underlying replication instance is alright from a resource use standpoint. The best practices explained in this AWS DMS whitepaper might help you get more perspective about this section.
Note: This section mentions some useful CloudWatch metrics. For some of these metrics, you might need to go into the CloudWatch log console to check them. We will go into more detail about CloudWatch metrics in another post.
The following are the most important resources on a host that must be optimally functioning at all times during the migration, and the reasons why they are important.
CPU
AWS DMS is a service that is designed for heterogeneous migrations, but it also supports homogeneous migrations. Because of this, even for homogeneous migrations, data conversions are a two-step process:
- Convert the source data type to an AWS DMS type data type.
- Convert the AWS DMS type data to the target data type.
You can find references for these conversions for each engine in the AWS DMS User Guide. Because AWS DMS needs to go through with these conversions optimally, the CPU must be available at the time that the conversions happen. Overloading the CPU and not having enough CPU resources could result in slow migrations, which can also cause other side effects.
AWS DMS currently supports many instances types.
If you’re using a t type instance for your migration and see that the credit usage is high and the credit balance often runs out, you could effectively upgrade your instance to a non-burstable type instance and continue with your migrations without issues. To keep yourself informed about the CPU utilization of your replication instance, monitor the CPU Usage metric for the replication instance.
Memory
CPU is important for data conversion, but memory is one of the most important resources during the CDC phase. Although the CDC process is done differently for different database sources, AWS DMS creates streams to the source and target and stores information in the stream buffers in memory on the replication instance.
In short, here is the process:
- Capture a stream of changes, reading them directly from the source instance transaction logs, and store them in your in memory buffer.
- Pre-process and convert the unloaded change transactions according to the target database engine.
- Once the conversion is done, apply those changes on the target. This could be a transactional apply or a batched apply, based on the target database engine.
From this process, you can see how important the memory resource is during the migration. There are set thresholds (from task settings) that AWS DMS operates on that could swap the changes from the memory into a location on the disk in case the memory utilization is above these set thresholds. This could happen for a variety of reasons, including the following:
- The target is slow in accepting and committing changes from AWS DMS. This could be due to a lack of indexes or other secondary objects. Or it could also be because the target database instance is not provisioned appropriately.
- Too many tasks are running on the same replication instance, causing a lot of swap.
- Too many changes are being read from the source for a particular task, which could be causing memory pressure. This could mean that you might have to split that task across multiple replication instances to take care of CDC.
There are also ways to monitor this using the following replication instance metrics:
- Freeable memory: Indicates the amount of available memory at a given point in time.
- Swap usage: Indicates the amount of swap space used on the replication instance.
Freeable memory is not an indication of the actual free memory available. It is the memory that is currently in use that can be freed and used for other uses. It is a combination of buffers and cache that are in use on the replication instance. Although the freeable memory metric does not reflect actual free memory available, the combination of the freeable memory and swap usage metrics can indicate whether the replication instance is overloaded.
Example: Let’s say that you see the following error messages in an AWS DMS task log:
Given that it clearly says that AWS DMS could not allocate memory, we could check the FreeableMemory metric to see the memory utilization:
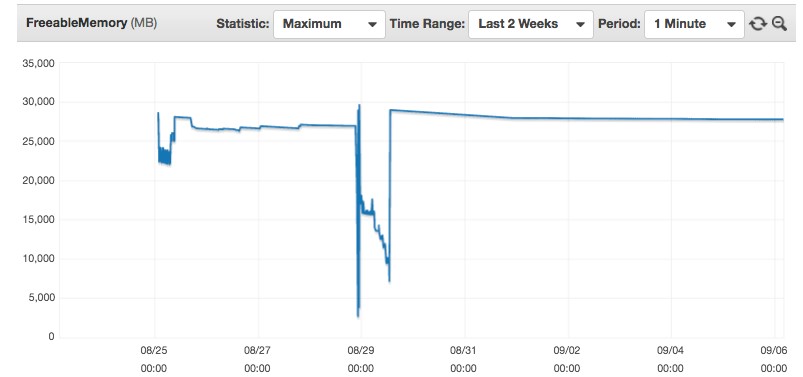
If you look at this CloudWatch graph closely for an AWS DMS replication instance, you notice that the instance almost ran out of memory just before 00:00 UTC on 08/29. This means that the replication instance was overloaded at that point in time, and we should look at what was causing this memory pressure on the instance. It could be due to a variety of reasons as outlined in our best practices whitepaper linked earlier in the post. After you take care of the issue, this problem should not occur again.
Disk utilization
Like the specific use cases for CPU and memory, the underlying disk on the replication instance also needs to perform optimally. Apart from using the swap space on the disk as explained in the previous section, AWS DMS also uses the underlying disk for the following functions:
- Storing comma-delimited CSV files of the source database data that is being migrated during full load phase for CSV-based targets like PostgreSQL, MySQL, and Amazon Redshift. These engines are called CSV-based targets because loading bulk data from a CSV file is one of the best ways to load data into these database engines during the full load phase. These CSV files are initially created in the underlying storage based on which replication instance storage performance is important. Bulk loading from CSV files using the COPY command in PostgreSQL and LOAD DATA LOCAL INFILE in MySQL is considered a best practice for those particular engines.
- The replication logic also writes logs to the underlying disk, which are exposed via CloudWatch to end customers. There could be a slight increase in utilization when logs are being written in detail debug mode because AWS DMS is writing all relevant information into the task logs.
For these reasons, you need to make sure that the disk is performing well. Note that the underlying storage type for AWS DMS is GP2/SSD. This volume type is generally recommended for most workloads and low-latency interactive apps. These volumes deliver single-digit millisecond latencies and the ability to burst to 3,000 IOPS (input/output operations per second) for extended periods of time. However, the most important point to note is that GP2/SSD volumes can burst up to 3,000 IOPS (roughly half each for reads and writes) based on burst credits (like T2 type instances). The base level is decided based on the size of the volume (3 IOPS for every 1 GB). As a result, a 1,000 GB volume can support 3,000 IOPS forever, while smaller volumes work on a credit system.
Given this explanation, you can measure volume performance using the following useful replication instance metrics:
- Read IOPS and Write IOPS: Gives you the number of read and write IOPS at any given point in time on the instance.
- Disk queue depth: If the replication instance is maintaining an average queue depth of approximately five outstanding I/O operations per 1,000 IOPS that you provision, you can assume that you are consuming the capacity that you provisioned.
Example: One of our customers reported that AWS DMS migrations on a certain replication instance were running fine until approximately 00:00 UTC on 08/26. On further troubleshooting, we found that the customer had forgotten to disable detail debug logging from an earlier troubleshooting exercise. They saw this for the Free Storage Space metric for the AWS DMS instance:

There was no space left in the underlying storage on the replication instance. So their tasks could not write the required information on the disk and started failing. After they disabled the detail debug logging for their task and modified their instance to increase storage, everything went back to normal (from a little later than 00:00 UTC on 09/01).
At this point in the debugging process, you must have done the following:
- Finished troubleshooting all relevant errors from the default and debug task logs to see if you can complete debugging.
- Made sure that the replication instance, source, and target don’t have any performance issues and are provisioned according to all best practices.
Final notes
This post gives you a quick introduction to the initial steps that you need to take to debug AWS DMS migrations. It also emphasizes the importance of following best practices because they help resolve most AWS DMS issues. Given the nature of migrations and how complex they can be, you can use these steps to start collecting more data. This helps you know exactly what is going on with the migration and move towards mitigating those issues in a recommended manner.
In the next post in this series, we dissect the task settings and other relevant migration task artifacts to understand what might go wrong. That is followed by a post on CloudWatch metrics in AWS DMS.
About the Authors
 Akm Raziul Islam is a consultant with a focus on Database and Analytics at Amazon Web Services. He works with our customers to provide guidance and technical assistance on various database and analytical projects, helping them improving the value of their solutions when using AWS.
 Arun Thiagarajan is a database engineer with the Database Migration Service (DMS) & Schema Conversion Tool (SCT) team at Amazon Web Services. He works on DB migrations related challenges and works closely with customers to help them realize the true potential of the DMS service. He has helped migrate 100s of databases into the AWS cloud using DMS and SCT.