You may not have DBA in your job title but you and I both know that you’re the person responsible for the database, and you might as well have that title. You might consider yourself an accidental DBA, a reluctant DBA, an incidental DBA or even a forced DBA, but somehow you managed find your way to a place where you’re the person responsible for the local instance of SQL Server. You could probably use a little help now that you’ve arrived.
There is a lot of documentation out there describing how to set up your backups or maintain your databases, indexes, statistics, logs, and so on, and much of this work will be automated. However, what about the day-to-day T-SQL commands that you’re just going to have to run manually, over and over?
I took the following question online through various forums:
What are the top 5 T-SQL commands, scripts, or fragments that you have typed so often that they are now second nature?
I received many responses, and a pretty good collection of scripts. I also requested everyone to nominate scripts that used native commands only, and not their favorite third-party script or tool. A few, very clear winners rose to the top, and here are the top 10:
sp_who2 / sys.dm_exec_requests / sp_whoisactiveSTATISTICS IO/TIMEBACKUP DATABASEsp_helpDBCC SQLPERFsys.dm_exec_query_stats- R
ESTORE DATABASE RESTORE FILELISTONLYsp_spaceusedDBCC SHOW_STATISTICS
If you’re just getting started as a DBA, accidental or otherwise, these are the ones you should start memorizing now, because you’re going to need them frequently. My article Using SQL Prompt to Accelerate the Top 10 Most Common Database Scripts shows how to create a set of DBA snippets from these scripts, so you can run each of them with one or two simple keystrokes.
#1 sp_who2 / sys.dm_exec_requests / sp_whoisactive
For several reasons, I lumped these three scripts together. While I was very explicit in asking people not to nominate third party scripts, Adam Machanic’s sp_whoisactive kept showing up over and over again, so I decided that I couldn’t very well keep it off the list.
The sp_whoisactive script uses various DMVs to investigate current activity on the system. It will highlight, among other things, which queries are running long and where you might be experiencing blocking. Under the covers, it makes use of the sys.dm_exec_requests Dynamic Management View (DMV), so I decided to keep them together. The tool sp_who2 represents the ‘old way’ of looking at current activity on the system, and I’m including it here too mainly because I want people to stop using it. Instead, use sys.dm_exec_requests and the associated DMVs to find this information (or sp_whoisactive).
There are lots of ways to put together information out of these DMVs. Here’s one example that shows you what’s currently running on the system, the query text and the execution plan.
|
1 2 3 4 5 |
SELECT * FROM sys.dm_exec_requests AS der CROSS APPLY sys.dm_exec_sql_text(der.sql_handle) AS dest CROSS APPLY sys.dm_exec_query_plan(der.plan_handle) AS deqp; GO |
Listing 1
Armed with a simple script like this, you can quickly and easily see everything that you can see through sp_who2. Using the same data (the same FROM clause), you can start to slice and dice it in interesting ways. Here’s an example, which I don’t expect you to memorize:
|
1 2 3 4 5 6 7 8 9 10 11 12 13 14 15 16 17 18 19 20 21 22 23 24 25 |
SELECT SUBSTRING(dest.text, ( der.statement_start_offset / 2 ) + 1, ( CASE der.statement_end_offset WHEN -1 THEN DATALENGTH(dest.text) ELSE der.statement_end_offset - der.statement_start_offset END ) / 2 + 1) AS querystatement , deqp.query_plan , der.session_id , der.start_time , der.status , DB_NAME(der.database_id) AS DBName , USER_NAME(der.user_id) AS UserName , der.blocking_session_id , der.wait_type , der.wait_time , der.wait_resource , der.last_wait_type , der.cpu_time , der.total_elapsed_time , der.reads , der.writes FROM sys.dm_exec_requests AS der CROSS APPLY sys.dm_exec_sql_text(der.sql_handle) AS dest CROSS APPLY sys.dm_exec_query_plan(der.plan_handle) AS deqp; GO |
Listing 2
#2 SET STATISTICS IO/TIME
Frankly, I was a little surprised to see these SET STATISTIC IO / TIME commands come up so frequently. Personally, I stopped using them after I realized that they can distort the true performance of the query under analysis. Instead, I capture query metrics using extended events, because I’ve found it to have lower impact, and provide more accurate measures.
Nevertheless, for ‘quick and dirty’ testing, these commands provide valuable information, and are clearly popular.
|
1 2 3 4 5 |
SET STATISTICS IO ON; SET STATISTICS TIME ON; ... SET STATISTICS IO OFF; SET STATISTICS TIME OFF; |
Listing 3
Simply replace the ellipsis with your query, in Listing 3, and you’ll see a set of messages to written to Messages output within the SSMS query window, the amount of time spent on the query and the reads and writes the query causes.
|
1 2 3 4 5 6 7 |
(2636 row(s) affected) Table 'SalesOrderDetail'. Scan count 449, logical reads 1834, physical reads 3, read-ahead reads 8, lob logical reads 0, lob physical reads 0, lob read-ahead reads 0. Table 'SalesOrderHeader'. Scan count 1, logical reads 689, physical reads 0, read-ahead reads 0, lob logical reads 0, lob physical reads 0, lob read-ahead reads 0. Table 'Product'. Scan count 1, logical reads 16, physical reads 0, read-ahead reads 0, lob logical reads 0, lob physical reads 0, lob read-ahead reads 0. SQL Server Execution Times: CPU time = 0 ms, elapsed time = 321 ms. |
Focus are on the ‘logical reads’ for each of the tables referenced and on the ‘elapsed time’ for the query.
#3 BACKUP DATABASE
I’m not even remotely surprised that BACKUP DATABASE made the list; in fact, I expected it to be the #1 query, rather than #3. While you’re going to automate your production database backups so that they run without your direct intervention, it’s extremely common to need to create a few extra database backups.
For example, you might want a ‘fallback’ option before be deploying new objects to your database, or to create a copy of the QA database for some additional testing.
|
1 2 3 |
BACKUP DATABASE AdventureWorks2014 TO DISK = 'D:\bu\adw.bak' WITH COPY_ONLY; |
Listing 4
This is a straight forward database backup command. The only wrinkle I’ve added is to use the WITH COPY_ONLY clause. Since this is an ad hoc backup, I don’t want to interfere with any DIFFERENTIAL backups that might run subsequently.
Only a very few people listed BACKUP LOG as a commonly run command. This is probably because it’s just not something that a lot of people do manually, so it’s not one that comes to mind when talking about common scripts.
#4 sp_help
Based on how often sp_help came up in the survey, a lot of people spend a lot of time in databases that they probably didn’t design or build themselves. sp_help and its series of associated commands, such as sp_helpdb, sp_helpindex, and sp_helpfile, allow us to gather information about the target object. Running sp_help on different objects will result in different result sets, showing varying amounts of details for those objects. For example, Listing 5 will run sp_help on a table.
|
1 |
sp_help 'Sales.SalesOrderHeader'; |
Listing 5
This command returns quite a lot of information about the table, as you can see in Figure 1.
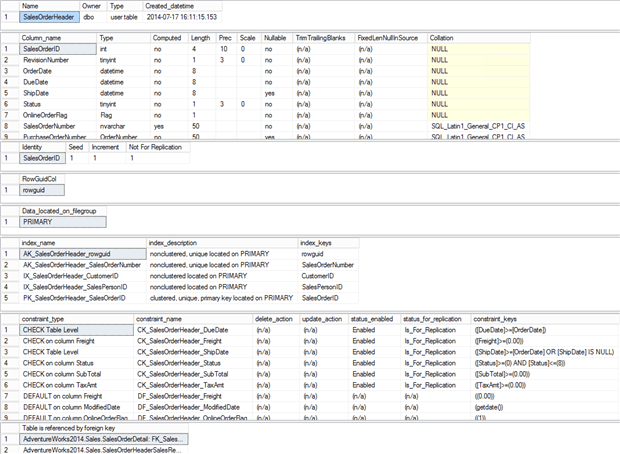
Figure 1
You can see the basics right at the top, describing the table in question, the table owner and data the table was created. Below that, you start seeing details. The second section shows the columns, such as the IDENTITY column and its definition.
Storage, indexes and constraints are all detailed, and finally information about which foreign keys reference this table.
If you’re not sure about a database or its design, sp_help is a quick, easy, and most importantly programmatic way to identify details about the objects within it.
#5 DBCC SQLPERF
Most DBAs have been taken by surprise, at one time or another, by extremely rapid growth in the size of the transaction log. It can be cause by lack of log backups, or infrequent log backups, or by some other problem, such as a long running or orphaned transaction that is preventing reuse of existing log space.
DBCC SQLPERF shows the size of the log for each database and the percentage of log space that is currently in use. This quickly allows you to assess which databases might need more log space, how much log space is currently in use, and if any are just too big.
Putting it to work is easy:
|
1 |
DBCC SQLPERF (LOGSPACE); |
Listing 6
The output is very easy to understand:
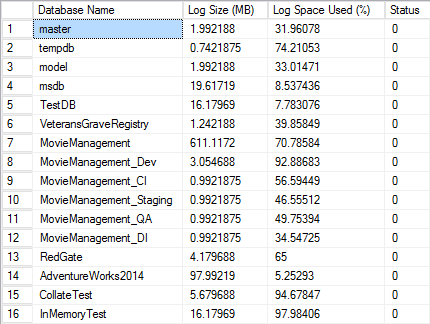
Figure 2
In addition, you can also use DBCC SQLPERF to reset the statistics gathered on Waits and Latches by issuing commands to clear them.
|
1 2 3 |
DBCC SQLPERF("sys.dm_os_latch_stats" , CLEAR); DBCC SQLPERF("sys.dm_os_wait_stats" , CLEAR); GO |
Listing 7
Just remember, this resets these statistics completely to zero, so you won’t have any historical track from the moment you run the above commands.
#6 sys.dm_exec_query_stats
If sys.dm_exec_requests is the place to go to find out what requests are running on the server right now, then sys.dm_exec_query_stats is where you’ll find aggregated, server-wide data summarizing previous activity.
It shows aggregations of performance metrics on statements within queries, procedures and batches. However, this information is only retained on the queries that are currently stored in cache. As soon as the query leaves the cache, this information goes away completely. If the query comes back into cache, it starts over at scratch gathering its metrics. You use this DMV in similar ways to sys.dm_exec_requests.
|
1 2 3 4 5 6 7 8 9 10 11 12 13 14 |
SELECT SUBSTRING(dest.text, ( deqs.statement_start_offset / 2 ) + 1, ( CASE deqs.statement_end_offset WHEN -1 THEN DATALENGTH(dest.text) ELSE deqs.statement_end_offset - deqs.statement_start_offset END ) / 2 + 1) AS querystatement , deqp.query_plan , deqs.execution_count , deqs.total_worker_time , deqs.total_logical_reads , deqs.total_elapsed_time FROM sys.dm_exec_query_stats AS deqs CROSS APPLY sys.dm_exec_sql_text(deqs.sql_handle) AS dest CROSS APPLY sys.dm_exec_query_plan(deqs.plan_handle) AS deqp; |
Listing 8
Queries against sys.dm_exec_query_stats, especially when combined with other DMVs, can provide meaningful and useful information, but just remember that these are aggregates, so it won’t show individual parameter values or row counts or other results related to individual executions of the query.
You can also look to sys.dm_exec_procedure_stats to see the same kind of information on stored procedures.
#7 RESTORE DATABASE
On the one hand, I’m rather shocked to see RESTORE DATABASE so far down the list. On the other hand, when I think about the number of backups I have done versus the number of times I’ve used those backups to restore a database, it makes sense. On the gripping hand, I’m not surprised that it made the list because we’ve all had to restore a backup or three.
Entire articles have been written about all the details of the RESTORE process. Listing 9 shows one use of RESTORE that comes up a lot, namely creating a new database from the BACKUP file.
|
1 2 3 4 5 |
RESTORE DATABASE ADW FROM DISK = 'D:\bu\adw.bak' WITH MOVE 'AdventureWorks2014_Data' TO 'E:\data\adwnew.mdb', MOVE 'AdventureWorks2014_Log' TO 'F:\log\adwnewlog.ldb', NORECOVERY; |
Listing 9
The basics of the command are second nature to most DBAs. You have to define which database you’re restoring and then you have to deal with the files. In this case, I’m moving the data to a new location, with new names, in order to be able to restore a database to the same server that already has a copy of this database. Finally, I use the NORECOVERY option so that I can validate the RESTORE process before I open the database up to people. As a final step you just run RESTORE...WITH RECOVERY.
|
1 2 3 |
RESTORE DATABASE ADW WITH RECOVERY; GO |
Listing 10
#8 RESTORE FILELISTONLY
Closely related to RESTORE DATABASE is RESTORE FILELISTONLY. If you have to run a restore, you’re going to want to know what the logical names and physical locations of the files. Further, you’re going to want to know how many filesyou have because databases can have multiple data files, all of which have to be used during a RESTORE (not counting piece meal RESTOREs). The syntax is very simple.
|
1 2 |
RESTORE FILELISTONLY FROM DISK = 'c:\bu\adw.bak'; |
Listing 11
The results are very thorough. I’m going to just show a small sub-section of all the details:
| LogicalName | PhysicalName | Type | FileGroupName | Size |
| AdventureWorks2014_Data | E:\data\adw_data.mdf | D | PRIMARY | 282329088 |
| AdventureWorks2014_Log | F:\log\adw_log.ldf | L | NULL | 102760448 |
You can see everything you need to feedback to the RESTORE DATABASE operation (#7).
#9 sp_spaceused
One of the primary tasks you’re going to find yourself doing as a DBA is managing files on disks and worrying about disk space. One of the ways you’re going to worry about it is by investigating the individual objects, tables and indexes, which are using up your disk space. That’s where sp_spaceused comes in handy.
|
1 |
EXEC sys.sp_spaceused @objname = N'Sales.SalesOrderHeader'; |
Listing 12
The results are easy to understand.

Figure 3
If we don’t supply an object name, i.e. just run EXEC sys.sp_spaceused, then we’ll see results for the entire database, and return a very different set of results.
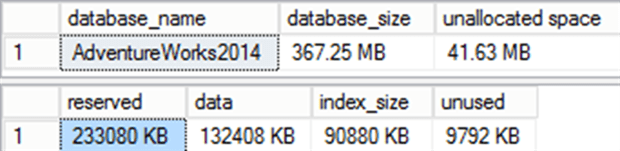
Figure 4
One additional argument that is worth noting is @updateusage, which when set to true will run DBCC UPDATUSAGE. It will rescan the system views that store this data and update pages and row counts so that they report more accurate size and space information.
For example, Listing 13 reruns sys.sp_spaceused for our SalesOrderheader table.
|
1 2 3 |
EXEC sys.sp_spaceused @objname = N'Sales.SalesOrderHeader', @updateusage = 'true'; GO |
Listing 13
I’ll get a slightly different set of results:

Figure 5
We now see a slightly different set of values form those shown in Figure 3; note that the reserved, index_size and unused values have changed. Running DBCC UPDATUSAGE can result in additional I/O load on your system, so exercise caution.
Many people have stopped using sp_spaceused in favor of directly querying the system tables and DMVs for object usage information. However, my survey results indicate the enduring popularity of sp_spaceused.
#10 DBCC SHOW_STATISTICS
Coming in at #10 is DBCC SHOW_STATISTICS. Again, I’m surprised it came in so far down the list. Maybe I’ve had to deal with bad parameter sniffing too many times. Maybe I just do lots of index and query tuning. Whatever the cause, I look at the statistics on my tables and indexes more than my peers, but clearly, they’re looking at them too since this command made the list.
If you want to see how SQL Server thinks your data looks to the optimizer, statistics are the answer. The syntax for retrieving them is pretty clear.
|
1 2 |
DBCC SHOW_STATISTICS('Sales.SalesOrderHeader', 'PK_SalesOrderHeader_SalesOrderID'); |
Listing 14
You just provide the table name and the name of the set of statistics in which you’re interested. In this example, I’m looking at the primary key. The results come in three parts.
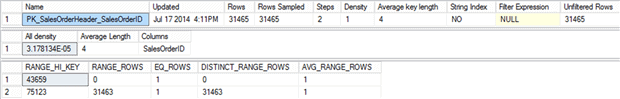
Figure 6
At the top is the header which provides some general information. Next is the density graph which shows the uniqueness or selectivity of the column or columns that make up this set of statistics. Finally, you have the histogram, up to 200 steps showing the data distribution of the first column out of however many columns there are in this set of statistics. I chose to show the primary key for the table so that you can see how, despite there being 31,465 rows in the table, the histogram only shows two steps. This is because every single one of those rows is unique for the primary key value, so the distribution doesn’t need 200 steps to show how things are laid out within the data.
Conclusion
Few if any of the scripts that appear on the Ten Most Common Database Scripts were a real surprise. The interesting thing for me was the variation in how individuals use these scripts or arrive at their own version of these scripts. Everyone out there has tasks in common. Everyone out there has tasks that are unique to them. Everyone out there finds new ways to solve these tasks, but most of us use a common set of tools.
I hope these scripts are helpful to anyone finding their way into the DBA role.
Load comments