


Running Elastic Cloud on Kubernetes from Azure Kubernetes Service
It's safe to say that Kubernetes is the de facto standard for orchestrating containers and the applications running in them. As the standard, a variety of managed services and orchestration options are available to choose from. In this blog post, we're going to take a look at running the Elastic Stack on Azure Kubernetes Service (AKS) using Elastic Cloud on Kubernetes (ECK) as the operator.
Elastic Cloud on Kubernetes, is the official operator for running the Elastic Stack on Kubernetes. ECK helps to manage, scale, upgrade, and deploy the Elastic Stack securely. In the steps below, we will deploy ECK on AKS and then use that deployment to collect logs, metrics, security events from a virtual machine on Azure.
Here's what we'll do:
- Create an Azure Kubernetes Service cluster
- Install Elastic Cloud on Kubernetes
- Create an Elasticsearch cluster
- Deploy Kibana
- Create an Azure VM for us to monitor
- Deploy Metric beat to collect VM metrics, and events
Deploying AKS, ECK, Elasticsearch, and Kibana
Note: You need to have Azure Account and the Azure CLI for Microsoft Azure installed to run some platform specific commands. This helps you to create your cluster using this Azure CLI command.
Step 1: Create an AKS cluster
az aks create --resource-group resourceGroupName --name clusterName --node-count 3 --generate-ssh-keys
Step 2: Connect to the AKS cluster
az aks get-credentials --resource-group resourceGroupName --name clusterName
Step 3: Install the ECK operator
kubectl create -f https://download.elastic.co/downloads/eck/1.7.1/crds.yaml
kubectl apply -f https://download.elastic.co/downloads/eck/1.7.1/operator.yaml
Step 4: Create an Elasticsearch cluster with a external IP
We're using the default load balancer that is available with Azure Kubernetes Service.
cat <<EOF | kubectl apply -f -
apiVersion: elasticsearch.k8s.elastic.co/v1
kind: Elasticsearch
metadata:
  name: quickstart
spec:
  version: 7.14.1 #Make sure you use the version of your choice
  http:
    service:
      spec:
        type: LoadBalancer #Adds a External IP
  nodeSets:
  - name: default
    count: 1
    config:
      node.store.allow_mmap: false
EOF
Note: Azure offers different storage options to run your applications on AKS. We recommend using SSD backed storage options for better performance.
Step 5: Monitor the cluster creation
kubectl get elasticsearch
kubectl get pods -w
Step 6: Check the logs of the pod created
kubectl logs -f quickstart-es-default-0
kubectl get service quickstart-es-http
Step 7: Retrieve the password of Elasticsearch cluster
PASSWORD=$(kubectl get secret quickstart-es-elastic-user -o=jsonpath='{.data.elastic}' | base64 --decode)
curl -u "elastic:$PASSWORD" -k "https://<IP_ADDRESS>:9200"
Note: The public IP address of Elasticsearch can be picked by running:kubectl get "kubectl get svc quickstart-es-http" |
Step 8: Deploy Kibana
cat <<EOF | kubectl apply -f -
apiVersion: kibana.k8s.elastic.co/v1
kind: Kibana
metadata:
  name: quickstart
spec:
  version: 7.14.1 #Make sure Kibana and Elasticsearch are on the same version.
  http:
    service:
      spec:
        type: LoadBalancer #Adds a External IP
  count: 1
  elasticsearchRef:
    name: quickstart
EOF
Step 9: Monitor the Kibana deployment
kubectl get kibana
Ingesting and analyzing Azure metrics
Now that we have created an Elasticsearch cluster with Kibana in AKS, let's go ahead and ingest some observability data from Azure Cloud itself. Filebeat and Metricbeat make this easy by coming with out-of-the-box an Azure Module, helping to easily gather logs (activity, sign in, audit) and metrics (vm, container registry, billing) from Azure Cloud Platform.
In this tutorial, we will install Metricbeat on an Azure VM and enable the Azure cloud module. Before that, we also need to have credentials to authenticate with Azure Monitoring REST API which uses Azure Resource Manager authentication model.
We need to have client_id, client_secret, subscription_id, tenant_id which can be obtained by creating an Azure Active Directory App. You can use this guide to Azure AD application and service principal that can access resources.
Step 1: Create a Azure VM and SSH into the VM
az vm create \
  --resource-group myResourceGroup \
  --name myVM \
  --image UbuntuLTS \
  --admin-username azureuser \
  --generate-ssh-keys
ssh azureuser@<IP_ADDRESS>
Step 2: Install Metricbeat
wget https://artifacts.elastic.co/downloads/beats/metricbeat/metricbeat-7.14.1-amd64.deb
dpkg -i metricbeat-7.14.1-amd64.deb
Step 3: Configure Elasticsearch and Kibana credentials in Metricbeat
This helps us to ship the data to Elasticsearch Cluster created on AKS as well as load dashboards in Kibana.
vim /etc/metricbeat/metricbeat.yml
 setup.kibana:
   host: "https://<public_ip_addr>:5601"
Note: The public IP address of Kibana can be picked by running:kubectl get "kubectl get svc quickstart-kb-http" |
vim /etc/metricbeat/modules.d/azure.yml.disabled
Replace the client_id, client_secret, subscription_id, tenant_id for all the metricsets listed in the yml file. A sample might look like this.
- module: azure
  metricsets:
  - monitor
  enabled: true
  period: 300s
  client_id: '8dec1ab1-1691-48a6-af43-f87de68e971b'
  client_secret: '~fwL-MhOcguaD2yK1e_.OWHhhqwdp-p974'
  tenant_id: 'aa40685b-417d-4664-b4ec-8f7640719adb'
  subscription_id: '70bd6e77-4b1e-4835-8896-db77b8eef364'
  refresh_list_interval: 600s
  resources:
  - resource_query: "resourceType eq 'Microsoft.DocumentDb/databaseAccounts'"
    metrics:
    - name: ["DataUsage", "DocumentCount", "DocumentQuota"]
      namespace: "Microsoft.DocumentDb/databaseAccounts"
Step 4: Enable Azure Module and start Metricbeat
cd /usr/bin/
./metricbeat modules enable azure
./metricbeat setup --dashboards
./metricbeat -e
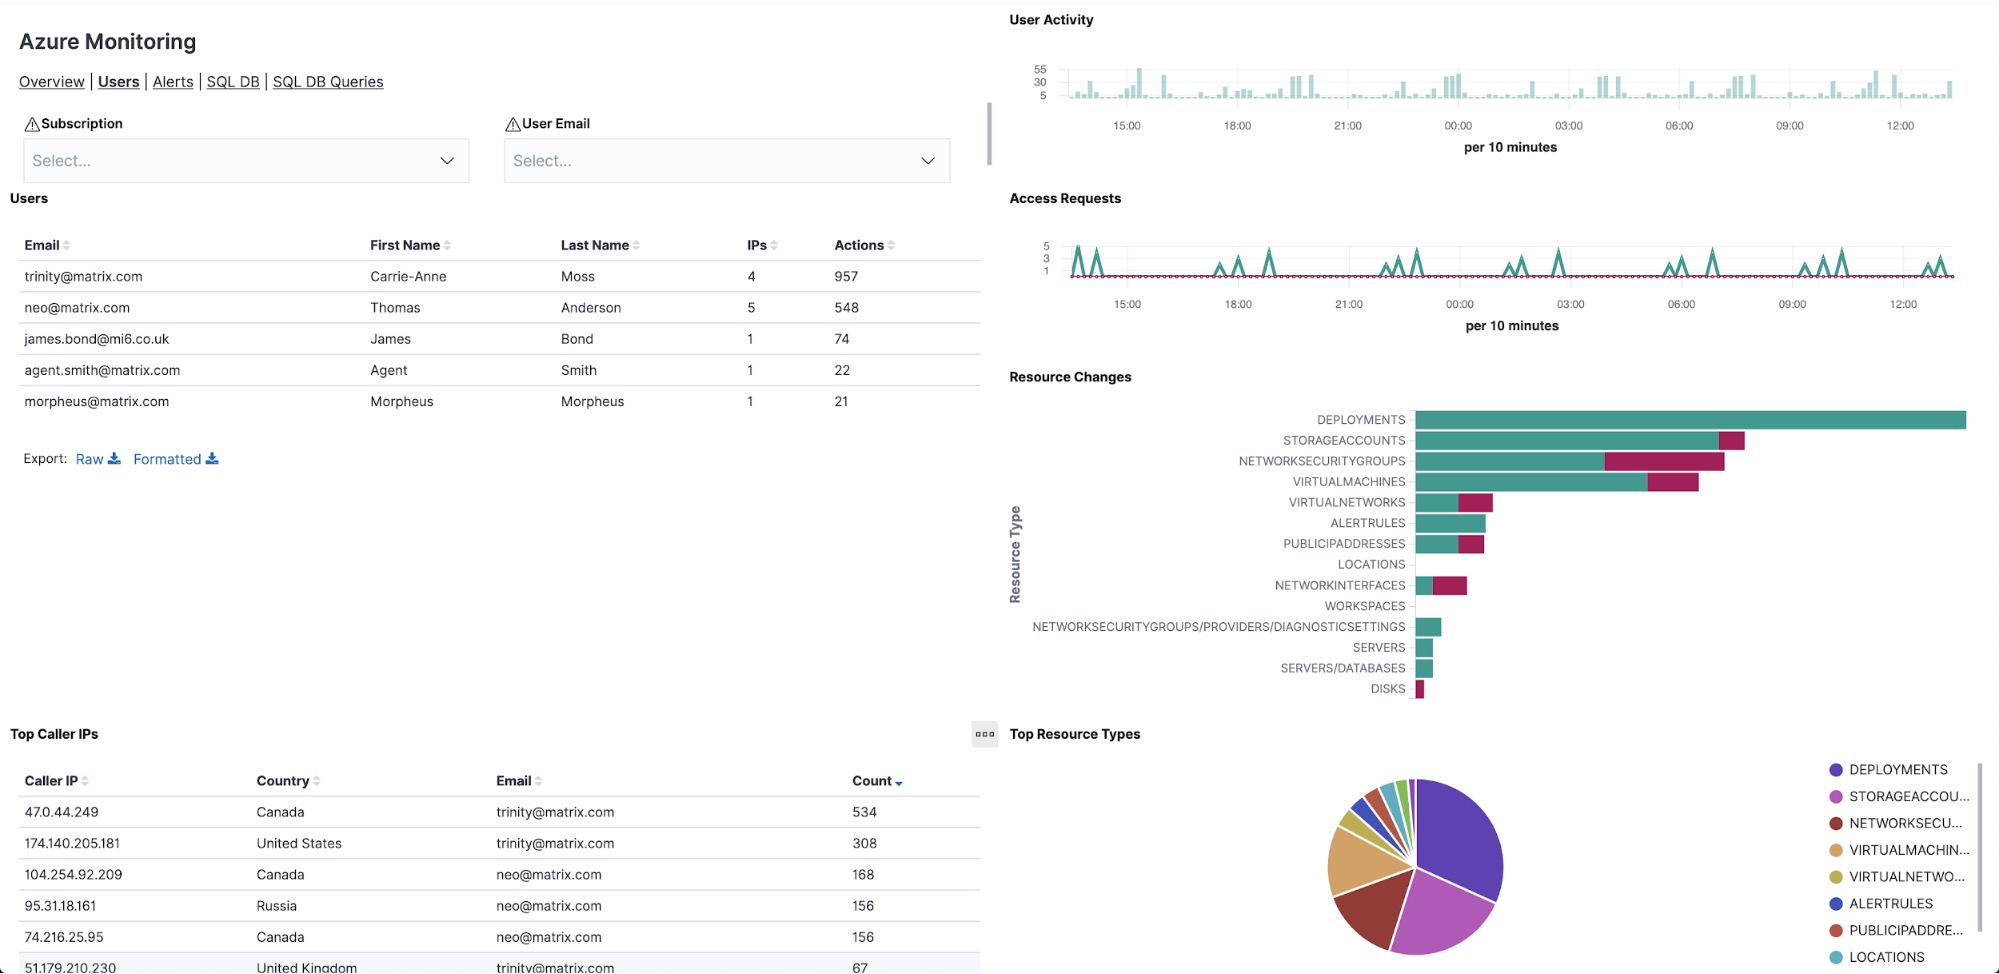
Step 5: Monitor Metrics of Azure in Kibana
Log into Kibana and headover to Dashboards. Search for "Azure" to look at several preconfigured dashboards regarding storage, database, billing. Here is what a sample monitoring dashboard would look like:
Wrapping up
And that's that! You have successfully built a secure Elastic Stack deployment on a managed Kubernetes service. You can also deploy other applications like Elastic APM or Elastic Workplace Search. In addition to that, you can also enable cross-cluster search and replication, which enables you to deploy a Elastic Stack on Kubernetes cluster across regions to serve users.
We encourage you to try ECK for yourself (on any service), and if you have further questions related to this blog post, you can always reach us out on our community discussion forums or Slack workspace.
If you'd like to learn more how Elastic can help with Kubernetes observability, check out our Best of Elastic Observability webinars series
.